Network Monitoring
The Network Monitoring menu contains submenus that display system-configured dashboards. These dashboards are tailored to provide comprehensive visual representations of network data and performance metrics. Users can access detailed insights into devices configured for distinct time periods, including 15 minutes, 30 minutes,1 hour, 12 hours, 24 hours, 7 days, 30 days, 90 days or 1 year. Users can utilize these submenus to track historical trends, analyze patterns, and assess the performance of network devices across different durations.
This chapter describes the following sections:
View Device Metrics
The Device Metrics dashboard allows you to monitor resources for the mounted devices. Using RESTCONF monitoring capabilities, the dashboard presents comprehensive information encompassing CPU, disk, memory, and host-related metrics.
The following list provides details on key features of device metrics:
Field | Description |
|---|---|
 | Reloads the data in the widget. |
 | Collapses (minimizes) the widget. Click again to show the details. |
 | Removes the widget from the dashboard. |
 | Exports the Dashboard in PDF format. You can choose the panels to include/exclude from the file. |
 | Displays data according to the date range. |
 | Allows to display data based on the following settings: • Quick Selection - displays data according to the selected input. • Date Time Picker - displays data according to the specified date range. • Auto refresh - if enabled, data is refreshed as per the specified time interval. • Dashboard color scheme - you can choose the color scheme to display the dashboard. • Manage Widgets - you can choose the widgets to be displayed on the dashboard. |
Note: This dashboard currently shows data from polling the device using RESTCONF. The data is not real-time, causing a 3-minute delay in fetching information based on the polling interval. To instantly update the page, click the reload icon in the toolbar.
Prerequisites
Ensure that the configured devices (through the device registration process) are available.
Procedure
1. In the IP Maestro home page, navigate to Network Monitoring > Device Metrics.
2. Click the Device drop-down to select a device from the available list of registered devices.
The following list provides details on the key features of device metrics:
Field | Description |
|---|---|
CPU Information | |
CPU Usage | Percentage of CPU usage. |
1 min Load | Percentage of load to the CPU over 1 minute for the selected device. |
5 min Load | Percentage of load to the CPU over 5 minutes for the selected device. |
15 min Load | Percentage of load to the CPU over 15 minutes for the selected device. |
RAM Information | |
RAM Usage | Percentage of RAM usage. |
RAM Details | Details of Total, Used and Available RAM in megabytes. |
Other Details | Details about Shared memory, Buffers and number of processes running currently. |
Swap Memory | The total, used and available swap space in megabytes. |
High Memory | The total, used and available high memory in the RAM in megabytes. |
CPU Usage Chart - Historical | Chart showing the percentage of CPU utilization, and load details for different time intervals. |
RAM Usage Chart - Historical | Chart showing the Total, Used and Available memory with respect to RAM usage. |
Hard Disk Information | Detailed information about the hard disk and disk activity. |
View Interface Statistics
The Interface Statistics dashboard gives a visual representation of the interface specific to the selected device.
The dashboard displays a data table containing a comprehensive list of all interfaces, displaying the administrative and operational statuses, alongside additional miscellaneous statistics (such as Speed, MAC, and so on.). It also includes the timestamp of the last change made to each interface.
In conjunction with the data table, the dashboard provides aggregated metrics reflecting inbound and outbound traffic for these interfaces. These metrics offer a summarized view of traffic flow and activity on the selected device's interfaces.
The following list describes some of the key features and functionalities of the interface statistics details:
Field | Description |
|---|---|
| Reloads the data in the widget. |
| Collapses (minimizes) the widget. Click again to show the details. |
| Removes the widget from the dashboard. |
| Exports the Dashboard in PDF format. You can choose the panels to include or exclude from the file. |
| Displays data according to the date range. |
| Allows to display data based on the following settings: • Quick Selection - displays data according to the selected input. • Date Time Picker - displays data according to the specified date range. • Dashboard color scheme - you can choose the color scheme to display the dashboard. • Manage Widgets - you can choose the widgets to be displayed on the dashboard. |
Note: This dashboard currently shows data from polling the device using RESTCONF. The data is not real-time, causing a 3-minute delay in fetching information based on the polling interval. To instantly update the page, click the reload icon in the toolbar.
Prerequisites
Ensure that the configured devices are available through the device registration process.
Procedure
1. In the IP Maestro home page, navigate to Network Management > Interface Statistics.
2. Click the Device drop-down to select a device from the available list of registered devices.
3. Click the Interface(s) drop-down to select a particular interface. This is an optional step.
• Click Transceiver Details checkbox to get the Transceiver Overview on the dashboard. This checkbox is only visible once you select the interface and works on a single interface at a time.
The Interface Statistics details are displayed as follows:
Field | Description |
|---|---|
Interface Statistics | Represents the data in tabular view and provides the following information for the selected interface: • Interface • Admin Status • Oper Status • LastChange-Flapped • Speed • Rx Bytes • Tx Bytes • Rx Packets • Tx Packets • Index • MAC • Action |
Transceiver Overview | Displays the transceiver overview and operational data as detailed in the following section. |
Network Traffic Bandwidth | Displays the network traffic bandwidth in bytes per second. |
Network Traffic (Bytes) | Displays the network traffic in bytes. |
Network Traffic (Packets) | Displays the network traffic in packets. |
Errors and Discards | Displays the errors and discards in packets. |
Note: The traffic data represented indicates the total aggregate traffic through the port.
Transceiver Overview
The transceiver overview displays data in two parts - Overview and Operational Data.
Overview
This section provides the following details:
Field | Description |
|---|---|
Transceiver | The status of the transceiver |
Vendor | Name of the vendor Hover on the  icon for the vendor details. icon for the vendor details. |
Part Number | Part number of the transceiver |
Serial Number | Serial number of the transceiver |
Identifier | Identifier for the transceiver |
Connector Type | The type of connector for the transceiver |
Nominal BR | The nominal bit rate (BR) of the interface Hover on the icon for more details. |
DDM Support | The support for Digital Diagnostic Monitoring (DDM) |
Channel Count | The number of channels |
Other Details | Displays the following details: • Encoding Algorithm • Removable - true or false • Check Code • Ethernet Compliance Code • Extended Check Code • Length SMF • Length OM1 • Length OM2 • Length OM3 |
Transceiver Overview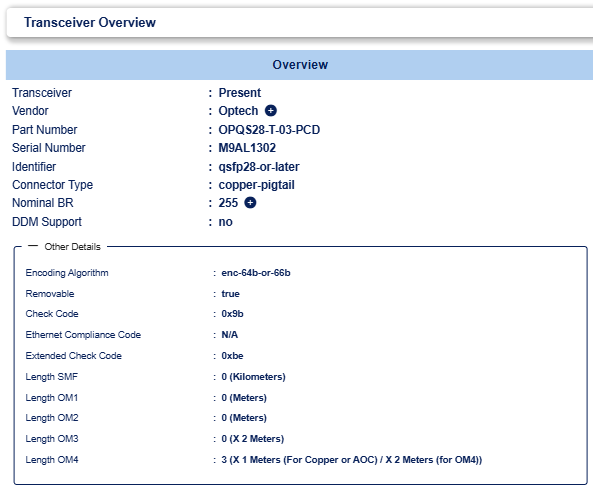
Operational Data
This section provides the averaged operational data per 30 minutes interval. Along with the latest reading, it also displays a Historical View, which is a graphical representation of the data.
It provides the following details:
Field | Description |
|---|---|
Temperature | The latest temperature reading in Celsius. |
Voltage | The latest voltage reading in Volts. |
Laser Biased Current | The Laser biased current reading for each of the channels in milliampere (mA). |
Input Power (RX) | The latest input power reading in decibel-milliwatts (dBm). |
Output Power (Tx) | The latest output power reading decibel-milliwatts (dBm). |
Operational Data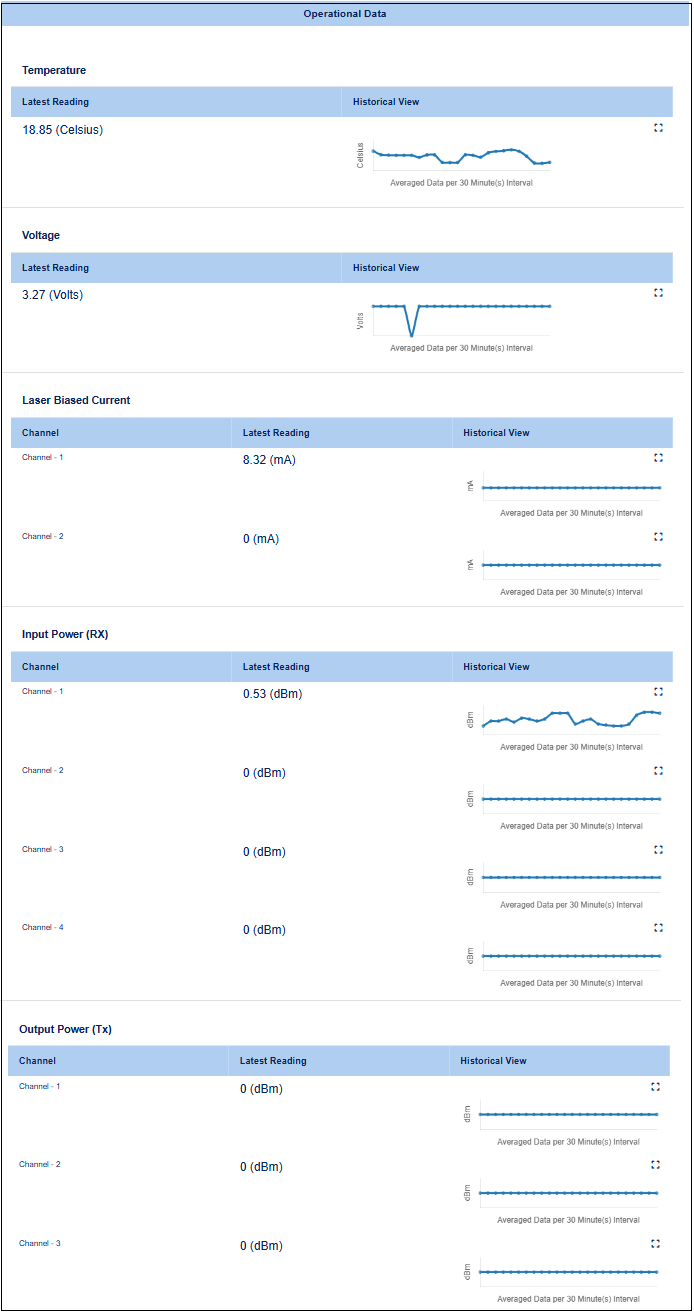
The Historical View can be expanded for an enlarged representation of data.
Clear Interface Counters
The Interface Statistics table provides a wide range of information on the traffic and inbound/outbound packets for the selected interface. There is an option to clear the information and reset the values for one or more interfaces.
Procedure
1. In the IP Maestro home page, navigate to Network Management > Interface Statistics.
2. Click the Device drop-down to select a device from the available list of registered devices.
3. In the Interface Statistics table, click the Clear Interface Counters  icon at the end of the interface row for which you want to clear the counter.
icon at the end of the interface row for which you want to clear the counter. 4. At the confirmation dialog, click Yes to confirm.
The counters are cleared and all the values are reset to zero.
Alternatively, you can follow the below steps to clear the counters for more than one interface at a time:
1. Select the check-box at the start of the required interface rows.
2. Click the Bulk Clear Interface Counters icon that is enabled above the statistics table.
3. Click Yes at the confirmation dialog that is displayed.
View Chassis Monitoring
Chassis Monitoring dashboard allows you to retrieve the device-specific information concerning device type, power supply, fan, and sensors for the selected device. This dashboard offers a visual representation of the hardware metrics associated with mounted devices.
There are two sections of the dashboard.
• Top Section: It presents a summary and detailed information for the selected device. When a physical device is selected, this section displays the following information:
• Summary Fieldset: Displays fundamental parameters pertinent to the device.
• Details Fieldset: Provides miscellaneous values retrieved from the device.
However, if a Virtual Machine is selected, only its summary is visible.
• Bottom Section: It offers an aggregate perspective on hardware-specific metrics, focusing on the hardware chassis. It includes details concerning:
• Power Supplies
• System Sensors
• Fans
The following list provides details on key features of chassis monitoring:
Field | Description |
|---|---|
| Reloads the data in the widget. |
| Collapses (minimizes) the widget. Click again to show the details. |
| Removes the widget from the dashboard. |
| Exports the Dashboard in PDF format. You can choose the panels to include/exclude from the file. |
| Displays data according to the date range, |
| Allows to display data based on the following settings: • Quick Selection - displays data according to the selected input. • Date Time Picker - displays data according to the specified date range. • Dashboard color scheme - you can choose the color scheme to display the dashboard. • Manage Widgets - you can choose the widgets to be displayed on the dashboard. |
Note: This dashboard currently shows data from polling the device using RESTCONF. The data is not real-time, causing a 3-minute delay in fetching information based on the polling interval. To instantly update the page, click the reload icon in the toolbar.
Prerequisites
Ensure that the configured devices (through the device registration process) are available.
Procedure
1. In the IP Maestro home page, navigate to Network Monitoring > Chassis Monitoring.
2. Click the Device drop-down to select a device from the available list of registered devices:
.
Field | Description |
|---|---|
Device Details | Displays the following data of the OcNOS device: • Host Name • IP Address • Software Version • Software Build • Boot Time • Device Model |
Device Summary | Displays a device summary for the OcNOS device, with details on the power supply, the total number of installed fans, fan cards, and system sensors on the devices. |
Power Supply Summary | Displays the summary of the power supply units. |
Power Supply Temperature Chart | Displays the temperature of the individual sensors installed on the devices. |
Sensor(s) Summary | Displays the summary of the sensors installed on the hardware devices. |
Sensor(s) Temperature Chart | Displays data on the temperature of all the installed sensors. |
Fan Summary | Displays the fan summary in Rotation Per Minute (RPM). |
Fan Speed Chart | Displays the data of the all the fans represented in the chart. |
Fan Card Summary | Displays data of the fan cards. |
Manage Device Logs
The Device Logs page helps you view logs, such as application logs, for the selected host. When a device is mounted, a remote syslog configuration is pushed into OcNOS to set up IP Maestro remote syslog server that will receive OcNOS device logs.
This dashboard provides a visualization of the logs for the selected devices. The logs can be filtered by Log Level and Protocol.
Note: This dashboard currently shows data from polling the device using RESTCONF. The data is not real-time, causing a 3-minute delay in fetching information based on the polling interval. To instantly update the page, click the reload icon in the toolbar.
The following list describes some of the key features and functionalities:
Field | Description |
|---|---|
 | Reloads the data. |
 | Opens the User Guide in a separate panel. |
| Displays data according to the date range. |
 | Auto refresh every 10 seconds. |
| Allows to display data based on the following settings: • Quick Selection - Displays data according to the selected input. • Date Time Picker - displays data according to the specified date range. • Auto refresh - If enabled, data is refreshed as per the specified time interval. Click Reset to Defaults to reset the values to back to default. |
This page contains two tabs:
View Device Logs
Prerequisite
Ensure that the configured devices are available.
Procedure
1. In the IP Maestro home page, click Network Monitoring > Device Logs.
2. In the Monitored tab, select a device from the available list of registered devices.
Field | Description |
|---|---|
Device(s) • Device IP • Host name | Select a device from the available list of registered devices. • IPv4 address of the device • Assigned name or label |
Severity | Select the severity of the log. |
Module | Select the protocol module name. |
Message Type | Choose from the list of message types. |
The device logs for the selected device are displayed with the following details:
Field | Description |
|---|---|
Host Name | Host name of the originating device. |
Device | IP address of the originating device. |
Timestamp | Date and time in Indian Standard Time (IST) format. |
Severity | Severity level of the log. |
Module | Protocol module name. |
Message Type | Log message type with embedded severity. |
Description | Detailed description of the log message. |
Upload Device Logs
You can import or load a previously saved device log file. The content is added to the database to provide persistent storage and retrieval capabilities.
Prerequisite
• Ensure that the configured devices (through the device registration process) are available.
• The device log file must be available for upload.
Procedure
1. In the IP Maestro home page, click Network Monitoring > Device Logs.
2. In the Uploaded tab, click Upload Log File(s) button at the right.
3. Click +Choose to select the file or drag and drop files to upload.
4. Enter the host IP address to associate with the logs from the uploaded file(s).
5. Click the Upload button.
Manage System Audit Logs
The System Audit Logs page provides audit logging of configuration changes to all the registered devices. It is a read-only menu where no write or delete capabilities are provided. It provides the ability to expand and view payload contents in a user-friendly format.
This page provides a group of tabbed panels used to display and filter various logs throughout IP Maestro and the network.
The following tabs can be used to display, filter, and inspect the information as listed below:
• Configuration Logs: Configuration history for all the devices and modifications applied to the network devices.
• Administrative Logs: History of all non-device configurations or operations .
• Monitoring Logs: History of all the monitoring logs.
• User Management Logs: Logs of all the user management actions.
Configuration Logs
This table provides a configuration history for all the devices in the network. Each log shows the device and its associated operation.
In addition to providing the details for each operation, most operations contain a configuration (or payload). When a payload is available for inspection, click the  icon within the desired row under the Action column.
icon within the desired row under the Action column.Prerequisite
The device already exists and is configured on the domain controller.
Procedure
1. In the IP Maestro page, click Network Monitoring > System Audit Logs.
2. Click the Configuration Logs tab to display the log status and configuration as follows:
Field | Device IP |
|---|---|
Device IP | Ipv4 address. |
Status | Command execution status. The possible values are: • Success • Failed |
Operation | The execution type to configure the device. |
Timestamp | The execution date and time logged by the system in IST. |
User | The user that applied the configuration. |
Browser | The originating address of the client. |
Origin | The servicing component responsible for command execution. |
Payload | The payload identifier in JSON format. |
3. Click the Action expansion icon to show the entire payload of the existing entries in a JSON-friendly format. The JSON Formatted Payload window is displayed showing the details of the existing entries.
to show the entire payload of the existing entries in a JSON-friendly format. The JSON Formatted Payload window is displayed showing the details of the existing entries.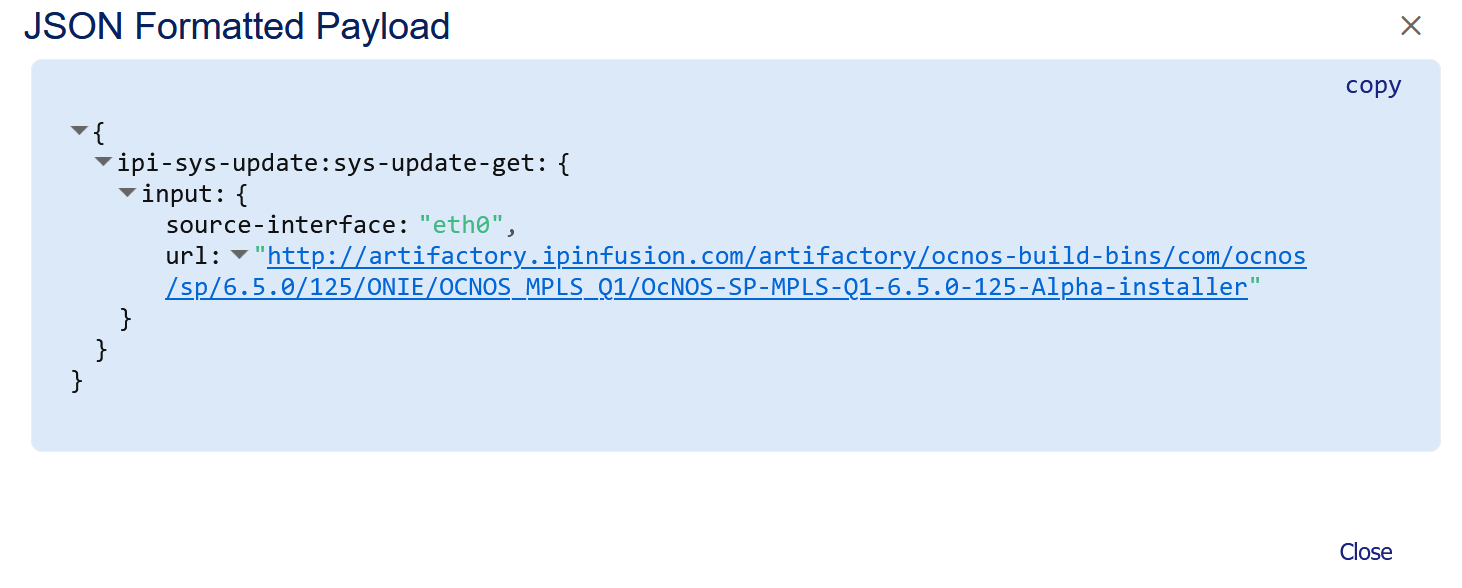
4. Click Close to close the JSON Formatted Payload window.
Administrative Logs
This table provides a configuration history for all other non-device configurations or operations.
Prerequisite
The device already exists and is configured on the domain controller.
Procedure
1. In the IP Maestro home page, click Network Monitoring > System Audit Logs.
2. Click the Administrative Logs tab to display all the non-device configurations and operations with the following details:
Field | Device IP |
|---|---|
Device IP | Ipv4 address. |
Status | Command execution status. The possible values are: • Success • Failed |
Operation | The execution type to configure the device. |
Timestamp | The execution date and time logged by the system in IST. |
User | The user that applied the configuration. |
Browser | The originating address of the client. |
Origin | The servicing component responsible for command execution. |
Monitoring Logs
This table provides a history of all the monitoring logs.
Prerequisite
The device already exists and is configured on the domain controller.
Procedure
1. In the IP Maestro home page, click Network Monitoring > System Audit Logs.
2. Click the Monitoring Logs tab to display the logs with the following details:
Field | Device IP |
|---|---|
Device IP | IPv4 address. |
Status | Operational status. The possible values are: • Success • Failed |
Type | The execution type to configure the device. |
Action | Enable or Disable |
Timestamp | The execution date and time logged by the system in IST. |
User | The user that applied the configuration. |
User Management Logs
This table provides logs of all the user management actions that are performed.
Procedure
1. In the IP Maestro home page, click Network Monitoring > System Audit Logs.
2. Click the User Management Logs tab to display the logs with the following details:
Field | Device IP |
|---|---|
Operation | The user management operation. |
Operation executed by | The system that executed the operation. |
Origin | The origin server of execution. |
Timestamp | The execution date and time logged by the system in IST. |
Details | The details of the user management operation. |