System Dashboards
The System Dashboards serve as visual interfaces that deliver a comprehensive status overview of the critical elements monitored by the IP Maestro domain controller. Upon a successful login, users are directed to the IP Maestro dashboard, which functions as the primary landing page. To access specific dashboards, click the designated tab.
View Network Dashboard
The Network Dashboard comprises multiple network-related panels featuring key contributors to the network. These panels encompass a device-platform summary, CPU utilization, memory utilization, interface traffic (outbound and inbound), fan speed, power supply temperature, and sensor temperature. Each panel operates autonomously and supports data refreshment functionality.
The following list describes some of the key features and functionalities of the panels:
Field | Description |
 | Reloads the data in the widget. |
 | Collapses (minimizes) the details. Click again to show the details. |
 | Removes the widget from the dashboard. |
 | Exports the dashboard in PDF format. |
 | Allows to display data based on the following settings: • Dashboard color scheme - you can choose the color scheme to display the dashboard. • Manage Widgets - you can choose widgets to show/hide on the dashboard. |
Prerequisites
The devices must be mounted as the dashboard displays data for the mounted devices only.
Procedure
1. In the IP Maestro home page, click Dashboards > Network.
2. Click the appropriate widget to view the details as displayed:
Field | Description |
Device Platform Summary | Summarizes the platform type mounted on the system. |
Top-10 CPU Utilization | Displays the top 10 CPU utilization across all devices. |
Top-10 RAM Utilization | Displays the top 10 memory utilization across all devices. |
Top-10 Interface Traffic (Inbound) | Displays the top 10 inbound traffic across all devices. |
Top-10 Interface Traffic (Outbound) | Displays the top 10 outbound traffic across all devices. |
Top-10 Fan Speed | Displays the top 10 fan speed traffic across all devices. |
Top-10 Power Supply Temperature | Displays the top 10 power supply temperature traffic across all devices. |
Top-10 Sensor Temperature | Displays the top 10 sensor temperature traffic across all devices. |
The details of the network-related dashboards are displayed.
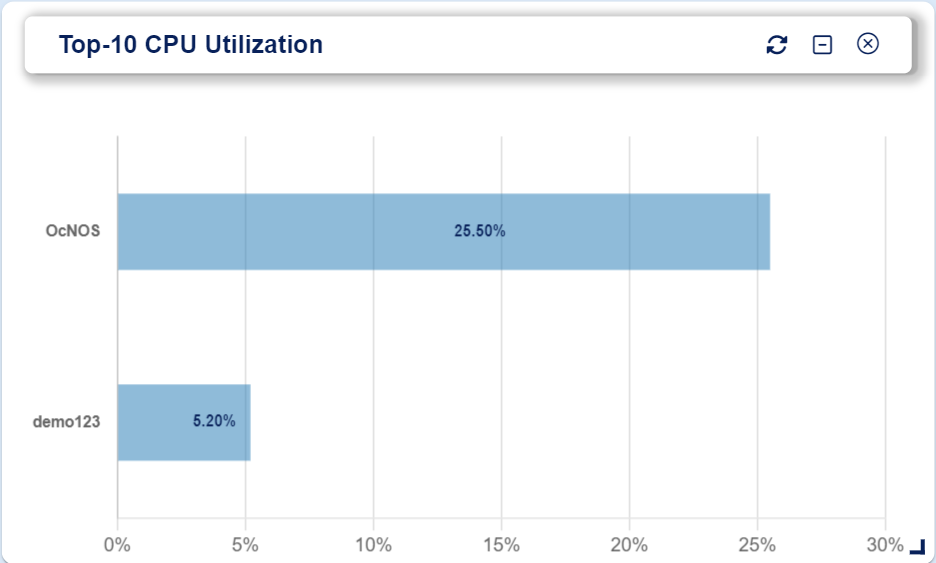
Top-10 CPU Utilization
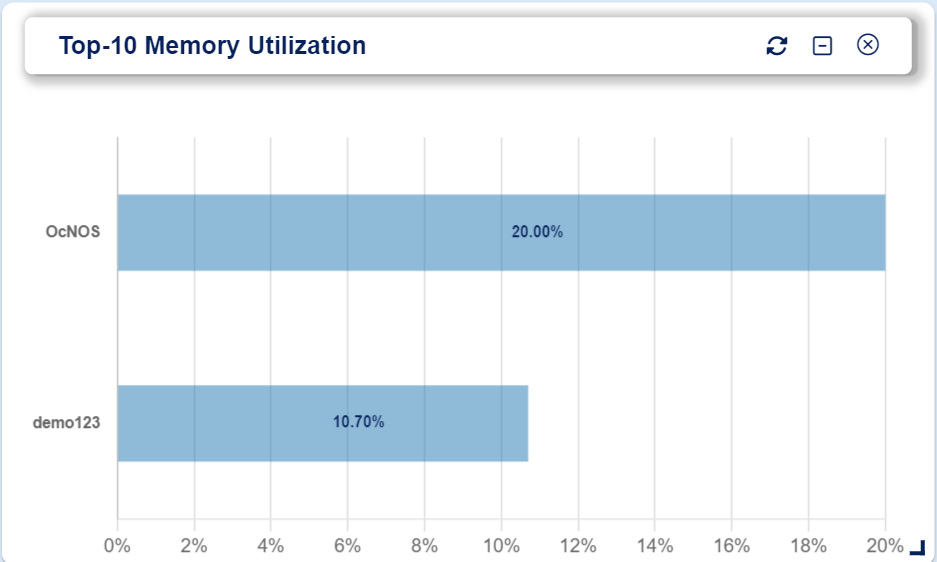
Top-10 Memory Utilization
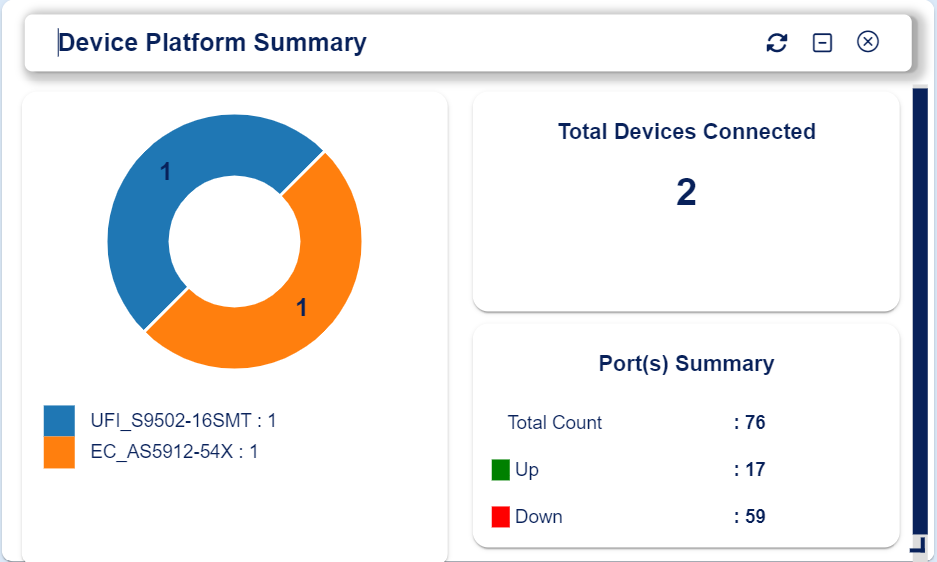
Device Platform Summary
.png)
Top-10 Interface Traffic (Inbound)
.png)
Top-10 Interface Traffic (Outbound)
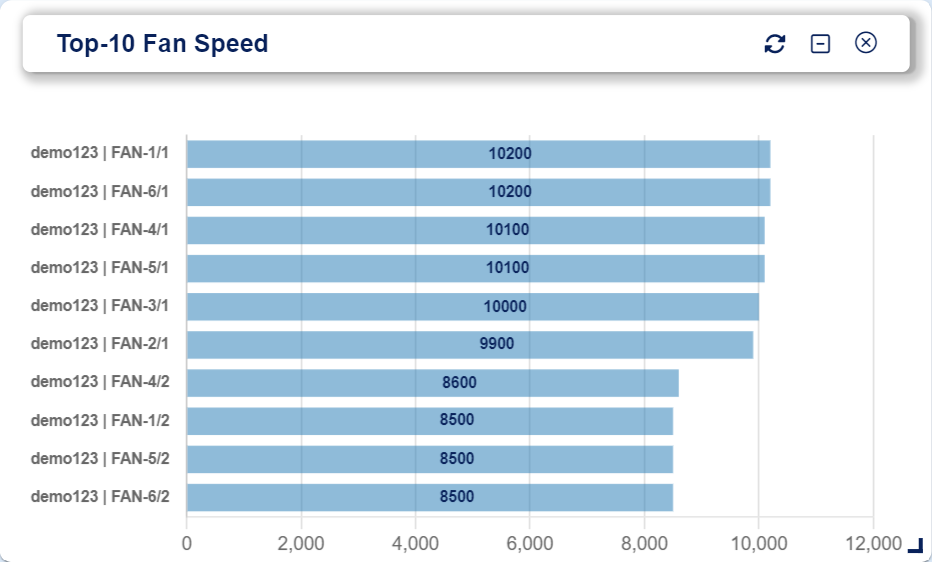
Top-10 Fan Speed
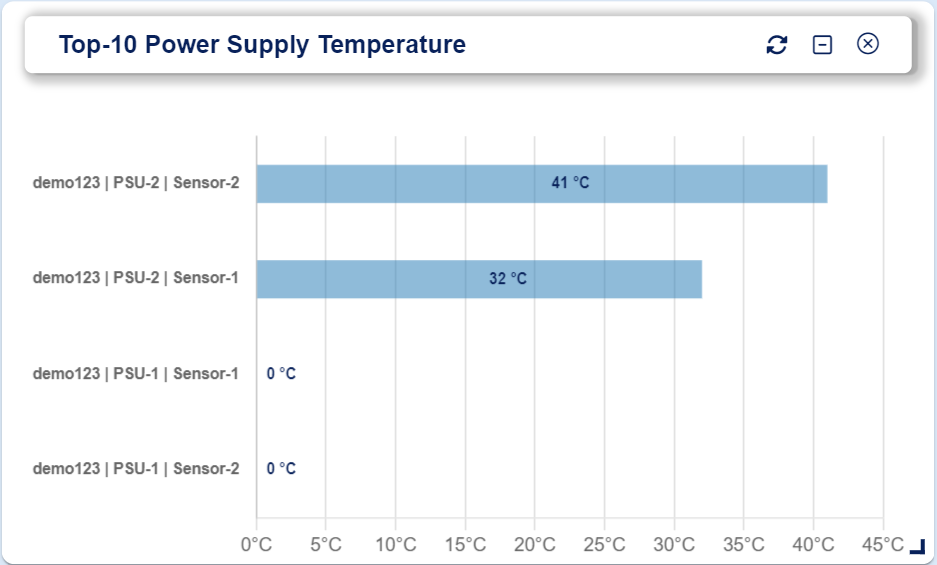
Top-10 Power Supply Temperature
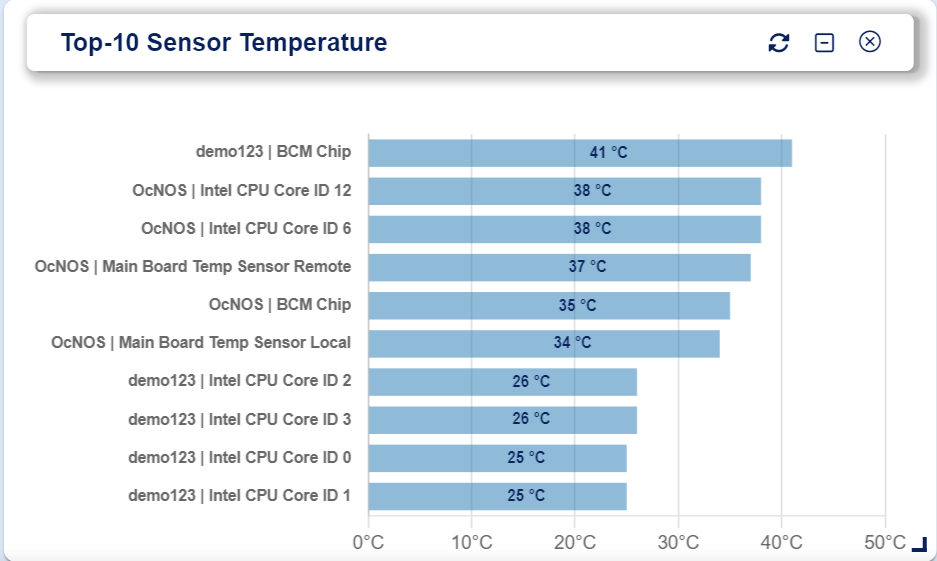
Top-10 Sensor Temperature
View Alarms Dashboard
The Alarms Dashboard facilitates the monitoring of active alarms associated with mounted devices. The count of alarms based on severity is displayed in color coded format, which can be clicked to filter the display.
Use the tabs at the right to customize the alarm display, as described in the table below.:
Field | Description |
All Alarms | Displays all active alarms. |
Acknowledged | Active alarms that are acknowledged by the current user. |
Unacknowledged | Active alarms that are not acknowledged by the current user. |
Note: By default, the unacknowledged alarms are displayed when the dashboard is opened.
The alarms table automatically updates as new alarms are raised. Click Alarm History icon at the end of each row to view the history (transitions) of the selected alarm.
Prerequisites
The devices must be mounted as the dashboard displays data for the mounted devices only.
Procedure
On the IP Maestro home page, click Dashboards > Alarms. The following details of the active alarms are displayed:
Field | Description |
Ack | Check box to acknowledge the alarm. |
Alarm | Alarm type. |
Device | IPv4 address of the device. |
Severity | Alarm severity levels that include Critical, Major, Minor, and Warning. |
Resource | Origin or source of the alarm. |
Description | Description of the alarm. |
Timestamp | Date and time in IST format. |
Action | Icon to view the alarm history. |
View Notifications Dashboard
The Notifications dashboard allows to monitor notifications (events) for the system. Use various filter options including clicking on the Error, Warning, and Info tabs to filter notifications that you are interested in.
Note: The notifications table automatically updates as new notifications are raised.
Prerequisites
The devices must be mounted as the dashboard displays data for the mounted devices only.
Procedure
On the IP Maestro home page, click Dashboards > Notifications. The following details of the notifications are displayed:
Field | Description |
Timestamp | Date and time in Indian Standard Time (IST). |
Source | Origin or source of the notification. |
Severity | Notification severity level. |
Description | Event description of the notification. |