Streaming Telemetry Dial-In Mode
Overview
Dial-in mode in streaming telemetry enables collectors to initiate connections with OcNOS routers to receive operational data of interest. In this mode, the collector sends a Subscribe Remote Procedure Call (RPC) request to the gNMI server (OcNOS target device), specifying the data paths to monitor. The server then streams the requested telemetry data to the collector, facilitating proactive network monitoring and troubleshooting.
Feature Characteristics
The gNMI-based Dial-in mode telemetry for the management plane supports three types of telemetry subscriptions: Poll, Once, and Stream. It enables the "STREAM" type subscription with "SAMPLING" mode for the Subscribe RPC. The gNMI-based collector connects to the OcNOS target device and invokes the Subscribe RPC, specifying the set of path(s) of interest. Two key components are involved in this process:
• gNMI Server (OcNOS Target): The gNMI server operates within the OcNOS device, serving as the source of telemetry data. It supports the gNMI protocol, allowing gNMI-based clients (collectors) to request and receive streaming data. The server streams the requested data to the client according to the specified parameters.
• gNMI Client (Collector): The gNMI client, also known as the collector, runs outside the OcNOS target device and is responsible for receiving and gathering telemetry data. In this context, it is the entity that connects to the OcNOS target device to collect data using the gNMI protocol. The collector initiates the Subscribe RPC to specify the data of interest.
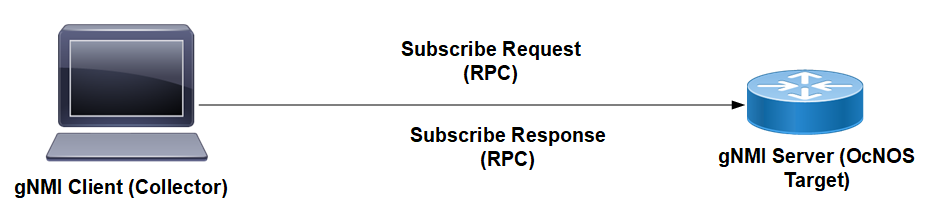
Figure 2-1 illustrates the gNMI client's (Collector) Subscribe request and response (RPC) interaction with the gNMI server (OcNOS Target).
Sample Subscribe Request
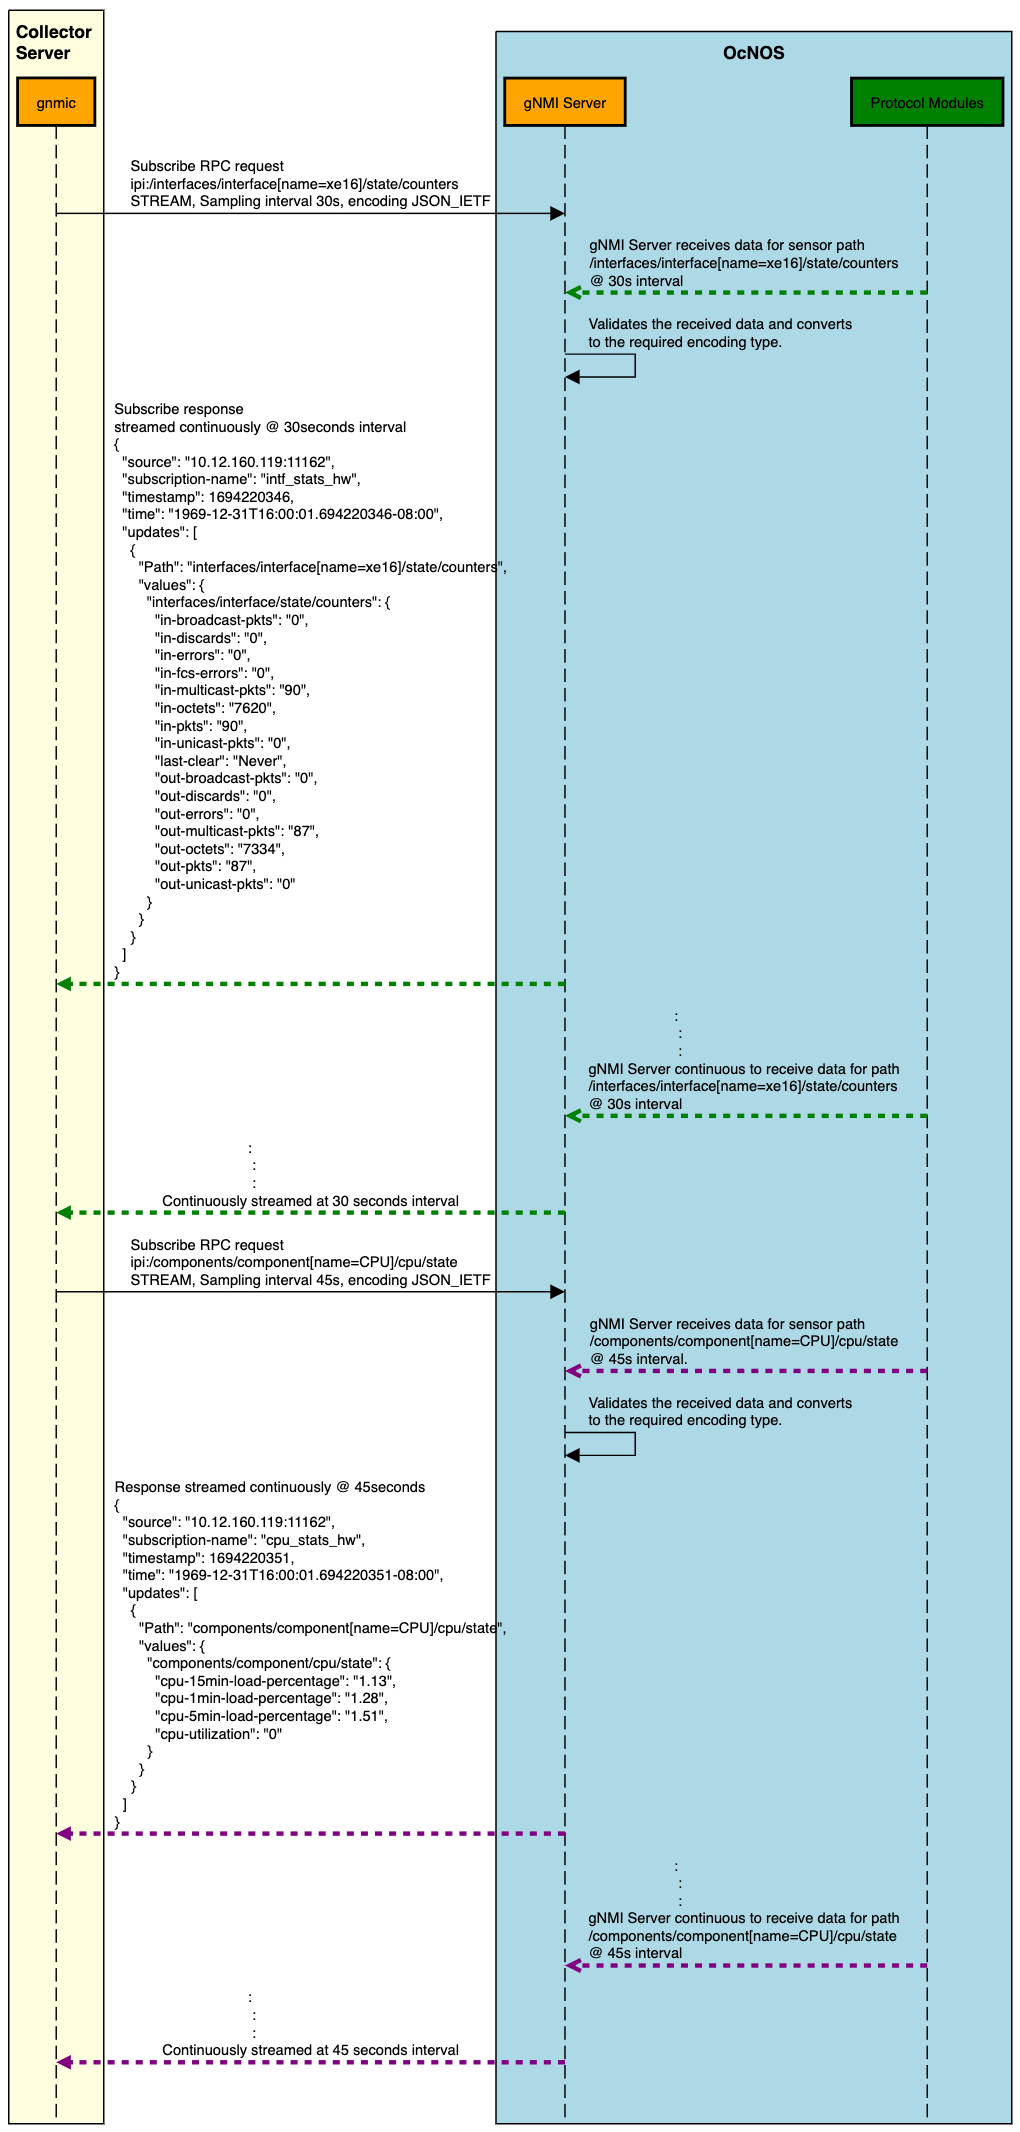
Example Message Flow: Subscribe Request and Response
Figure 2-2 illustrates a sample gnmic Subscribe Request and Subscribe Response between the collector and the OcNOS target device.
Step 1: Subscription Request Initiation
• The gnmic collector server initiates a Subscribe Request by sending a Subscribe RPC in Stream type.
• This subscription request aims explicitly to gather data related to interface state counters and CPU state.
• A fixed 30/45-second sampling interval is set for data collection.
Step 2: Data Collection and Processing
• The gNMI server, within the OcNOS router, is responsible for data collection.
• At regular 30/45-second intervals, it retrieves data from the sensor path, focusing on interface state counters and CPU State.
• The received data undergoes a validation process, and the data is transformed into the required encoding type.
Step 3: Continuous Subscription Response Streaming
• The gNMI Server responds to the subscription request by continuously streaming Subscribe Response data.
• This streaming process maintains the same 30/45-second interval as the data collection.
• The collected data is streamed in real-time to the gnmic collector server.
Message Flow: Subscribe Request and Response
Benefits
Proactive Network Monitoring: Obtain real-time insights into network health and performance, and how to enable quicker response to issues.
Resource Utilization Monitoring: Monitor CPU and memory utilization to optimize resource allocation and performance.
Predictive Troubleshooting: Identify patterns and potential issues before they impact the network, reducing downtime.
Automation and Resilience: Use telemetry data to automate network management tasks and design a more resilient network.
Prerequisites
Before configuring Dial-In mode, ensure that:
• A supported OcNOS router running a compatible release.
• Access to the management interface of the router.
• Any gNMI client that complies with gNMI specifications can be used as a client.
• Refer to the gnmic Installation to download the gNMI collector package.
Configuration
In this example, streaming telemetry with OcNOS is demonstrated, using 'gnmic' as the gNMI Client.
Note: To install the gnmic tool for managing network devices using gNMI, refer to the gnmic Installation.
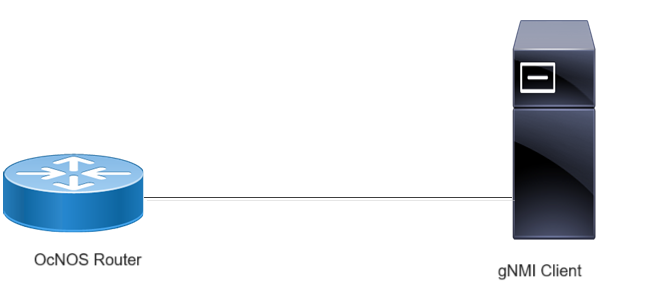
Dial-In Streaming Telemetry Topology
Note: Before configuring Dial-In, meet all Prerequisites.
Enable streaming telemetry in a default VRF on OcNOS:
OcNOS#configure terminal
OcNOS(config)#feature streaming-telemetry
OcNOS(config)#commit
Telemetry Subscription Request via gnmic Command and YAML Input
Use the gnmic command with a YAML file input to request telemetry subscriptions with multiple paths.
gnmic -a <ipaddress:port> -u <UserName> -p <Password> --insecure --config <path to config file> subscribe
This command establishes a telemetry subscription with the specified paths defined in the YAML file.
Telemetry Subscription Request via gnmic Command with a Single Path Option
Use the gnmic command with a single path option to request a telemetry subscription for a specific data path.
gnmic -a <ipaddress:port> -u <UserName> -p <Password> --encoding [json, json_ietf] --insecure --mode STREAM --stream-mode sample --sample-interval sample-interval-value sub --path <path>
gnmic -a <ipaddress:port> -u <UserName> -p <Password> --encoding [json, json_ietf] --insecure --mode [POLL, ONCE] sub --path <path>
gnmic -a <ipaddress:port> -u <UserName> -p <Password> --encoding proto --insecure --mode STREAM --stream-mode sample --sample-interval sample-interval-value sub --path <path> --proto-file IPI_OC.proto
This command creates a telemetry subscription for the specified path with the chosen sample interval and encoding format.
Supported gnmic Options
The following table explains the option fields.
gnmic Option Details
Option | Description |
|---|---|
--encoding | Specifies the encoding format as either json, proto, or json_ietf. The default encoding format is json. |
--mode | Sets the mode of operation (STREAM, POLL, and ONCE). |
--insecure | Allows insecure connections. |
--stream-mode | Sets the stream mode (Sample). |
--sample-interval | Sets the sample interval (10s). Note: Interval should be 10s or more. |
--config | Specifies the YAML configuration file path (Example: input_path.yaml). |
--path | Sets the path to subscribe to specific data (Example:‘ipi:/interfaces/interface[name]/state’). Note: For multiple paths specify each path with --path option. |
--prefix | Defines a common prefix for all specified paths (Example:‘ipi:/interfaces’). |
--proto-file | Path to Proto file (Example: IPI_OC.proto). |
Invoking Subscribe RPC with gnmic
Use Case 1: Monitoring Interface State with Single Path Option
In this use case, gnmic subscribes to a specific path using the Subscribe RPC, monitoring the state of an interface with the path 'ipi:/interfaces/interface[name=ce51]/state'.
#gnmic -a 10.12.91.111:9339 -u ocnos -p ocnos --encoding json_ietf --insecure --mode STREAM --stream-mode sample --sample-interval 10s sub --path 'ipi:/interfaces/interface[name=ce51]/state'
{
"source": "10.12.91.111:9339",
"subscription-name": "default-1695368813",
"timestamp": 1550833401338910123,
"time": "2019-02-22T11:03:21.388930123Z",
"updates": [
{
"Path": "ipi:interfaces/interface[name=ce51]/state",
"values": {
"interfaces/interface/state": {
"admin-status": "up",
"counters": {
"in-broadcast-pkts": "0",
"in-discards": "0",
"in-errors": "0",
"in-fcs-errors": "0",
"in-multicast-pkts": "23",
"in-octets": "2126",
"in-pkts": "23",
"in-unicast-pkts": "0",
"last-clear": "Never",
"out-broadcast-pkts": "0",
"out-discards": "0",
"out-errors": "0",
"out-multicast-pkts": "28",
"out-octets": "2552",
"out-pkts": "28",
"out-unicast-pkts": "0"
},
"ifindex": 10051,
"last-change": 15500,
"logical": false,
"oper-status": "up"
}
}
}
]
}
The output of the Subscribe RPC includes the following information:
Subscribe RPC Output details
Option | Description |
|---|---|
source | The source IP address and port of the gNMI server. |
subscription-name | The name of the subscription. |
timestamp | The timestamp of the response. |
time | The timestamp in a human-readable format. |
updates | An array of updates, each containing Path and Values. |
Path | The path to the subscribed data. |
values | The values of the subscribed data. |
Validation
The below show command provides details about the subscriptions that have been established, including the client ID, sampling interval, encoding type, and the sensor paths that are being monitored.
OcNOS#show streaming-telemetry dynamic-subscriptions
Feature streaming telemetry : Enabled
VRF : default
Platform type : Standard range
Maximum sensor-paths : 50
Minimum sample-interval : 90
Number of active sensor-paths : 2 (Dial-In : 2, Dial-out : 0)
SI : Sampling Interval in seconds
Enc-Type : Encoding type
Origin:Path : Sensor Path
Dial-In STREAM Mode Subscription Details:
~~~~~~~~~~~~~~~~~~~~~~~~~~~~~~~~~~~~~~~~~
ClientIP:Port ID SI Enc-Type Origin:Path
------------- ------ ---- -------- ------------
10.12.43.165:59304 4148 10 JSON_IETF ipi:interfaces/interface[name=ce51]/state/counters
ipi:interfaces/interface[name=ce51]/state
Use Case 2: Monitoring Interface State with Multiple Path Option
In this use case, gnmic subscribes to a specific path using the Subscribe RPC, monitoring the state of an interface with the multiple path 'ipi:/interfaces/interface[name=ce51]/state' and 'ipi:/interfaces/interface[name=ce52]/state'.
#gnmic -a 10.12.91.111:9339 -u ocnos -p ocnos --encoding json_ietf --insecure --mode STREAM --stream-mode sample --sample-interval 11s sub --path 'ipi:/interfaces/interface[name=ce51]/state' --path 'ipi:/interfaces/interface[name=ce52]/state'
{
"source": "10.12.91.111:9339",
"subscription-name": "default-1695377304",
"timestamp": 1550833401384910124,
"time": "2019-02-22T11:03:21.388940124Z",
"updates": [
{
"Path": "ipi:interfaces/interface[name=ce51]/state",
"values": {
"interfaces/interface/state": {
"admin-status": "up",
"counters": {
"in-broadcast-pkts": "0",
"in-discards": "0",
"in-errors": "0",
"in-fcs-errors": "0",
"in-multicast-pkts": "10",
"in-octets": "1060",
"in-pkts": "10",
"in-unicast-pkts": "0",
"last-clear": "Never",
"out-broadcast-pkts": "0",
"out-discards": "0",
"out-errors": "0",
"out-multicast-pkts": "10",
"out-octets": "1020",
"out-pkts": "10",
"out-unicast-pkts": "0"
},
"ifindex": 10051,
"last-change": 22500,
"logical": false,
"oper-status": "up"
}
}
}
]
}
{
"source": "10.12.91.111:9339",
"subscription-name": "default-1695377304",
"timestamp": 1550833401385910125,
"time": "2019-02-22T11:03:21.388950125Z",
"updates": [
{
"Path": "ipi:interfaces/interface[name=ce52]/state",
"values": {
"interfaces/interface/state": {
"admin-status": "up",
"counters": {
"in-broadcast-pkts": "0",
"in-discards": "0",
"in-errors": "0",
"in-fcs-errors": "0",
"in-multicast-pkts": "13",
"in-octets": "1664",
"in-pkts": "13",
"in-unicast-pkts": "0",
"last-clear": "Never",
"out-broadcast-pkts": "0",
"out-discards": "0",
"out-errors": "0",
"out-multicast-pkts": "10",
"out-octets": "1020",
"out-pkts": "10",
"out-unicast-pkts": "0"
},
"ifindex": 10052,
"last-change": 22500,
"logical": false,
"oper-status": "up"
}
}
}
]
}
Validation
The below show command provides details about the subscriptions that have been established, including the client ID, sampling interval, encoding type, and the sensor paths that are being monitored.
OcNOS#show streaming-telemetry dynamic-subscriptions
Feature streaming telemetry : Enabled
VRF : default
Platform type : Standard range
Maximum sensor-paths : 50
Minimum sample-interval : 90
Number of active sensor-paths : 4 (Dial-In : 4, Dial-out : 0)
SI : Sampling Interval in seconds
Enc-Type : Encoding type
Origin:Path : Sensor Path
Dial-In STREAM Mode Subscription Details:
~~~~~~~~~~~~~~~~~~~~~~~~~~~~~~~~~~~~~~~~~
ClientIP:Port ID SI Enc-Type Origin:Path
------------- ------ ---- -------- ------------
10.12.43.145:59334 42000 11 JSON_IETF ipi:interfaces/interface[name=ce52]/state/counters
ipi:interfaces/interface[name=ce52]/state
ipi:interfaces/interface[name=ce51]/state/counters
ipi:interfaces/interface[name=ce51]/state
Use Case 3: Monitoring Interface State Using Proto Encoding for IPI Xpath
In this use case, gnmic subscribes to the specified path using the Subscribe RPC, monitoring the state of an interface 'ipi:/interfaces/interface[name=eth0]/state' using the proto encoding.
./gnmic -a 10.12.160.119:9339 -u admin -p admin --insecure --mode STREAM --stream-mode sample --sample-interval 10s subscribe --path 'ipi:/interfaces/interface[name=eth0]/state' --encoding proto --proto-file IPI_OC.proto
{
"source": "10.12.160.119:9339",
"subscription-name": "default-1713864599",
"timestamp": 1550833401388910124,
"time": "2019-02-22T11:03:21.388910124Z",
"updates": [
{
"Path": "ipi:interfaces/interface[name='eth0']/state",
"values": {
"interfaces/interface/state": {
"adminStatus": "up",
"counters": {
"inMulticastPkts": "159435",
"inOctets": "902863924",
"inPkts": "732970",
"lastClear": "Never",
"outOctets": "8931839",
"outPkts": "105457"
},
"ifindex": 3,
"lastChange": 8000,
"operStatus": "up"
}
}
}
]
}
Validation
The below show command provides details about the subscriptions that have been established, including the client ID, sampling interval, encoding type, and the sensor paths that are being monitored.
OcNOS#show streaming-telemetry dynamic-subscriptions
Feature streaming telemetry : Enabled
VRF : default
Platform type : Standard range
Maximum sensor-paths : 50
Minimum sample-interval : 90
Number of active sensor-paths : 2 (Dial-In : 2, Dial-out : 0)
SI : Sampling Interval in seconds
Enc-Type : Encoding type
Origin:Path : Sensor Path
Dial-In STREAM Mode Subscription Details:
~~~~~~~~~~~~~~~~~~~~~~~~~~~~~~~~~~~~~~~~~
ClientIP:Port ID SI Enc-Type Origin:Path
------------- ------ ---- -------- ------------
10.12.66.120:53246 14087 10 PROTO ipi:/interfaces/interface[name=eth0]/state
ipi:/interfaces/interface[name=eth0]/state/counters
Use Case 4: Monitoring Interface State Using JSON Encoding for IPI Xpath
In this use case, gnmic subscribes to the specified path using the Subscribe RPC, monitoring the state of an interface 'ipi:/interfaces/interface[name=eth0]/state' using the JSON encoding.
./gnmic -a 10.12.160.119:9339 -u admin -p admin --insecure --mode STREAM --stream-mode sample --sample-interval 10s subscribe --path 'ipi:/interfaces/interface[name=eth0]/state' --encoding json
{
"source": "10.12.160.119:9339",
"subscription-name": "default-1713864619",
"timestamp": 1550833421055660410,
"time": "2019-02-22T11:03:41.05566041Z",
"updates": [
{
"Path": "ipi:interfaces/interface[name=eth0]/state",
"values": {
"interfaces/interface/state": {
"admin-status": "up",
"counters": {
"in-broadcast-pkts": 0,
"in-discards": 0,
"in-errors": 0,
"in-multicast-pkts": 159470,
"in-octets": 902867237,
"in-pkts": 733016,
"in-unicast-pkts": 0,
"last-clear": "Never",
"out-broadcast-pkts": 0,
"out-discards": 0,
"out-errors": 0,
"out-multicast-pkts": 0,
"out-octets": 8938196,
"out-pkts": 105490,
"out-unicast-pkts": 0
},
"ifindex": 3,
"last-change": 8000,
"logical": false,
"oper-status": "up"
}
}
}
]
}
Validation
The below show command provides details about the subscriptions that have been established, including the client ID, sampling interval, encoding type, and the sensor paths that are being monitored.
OcNOS#show streaming-telemetry dynamic-subscriptions
Feature streaming telemetry : Enabled
VRF : default
Platform type : Standard range
Maximum sensor-paths : 50
Minimum sample-interval : 90
Number of active sensor-paths : 2 (Dial-In : 2, Dial-out : 0)
SI : Sampling Interval in seconds
Enc-Type : Encoding type
Origin:Path : Sensor Path
Dial-In STREAM Mode Subscription Details:
~~~~~~~~~~~~~~~~~~~~~~~~~~~~~~~~~~~~~~~~~
ClientIP:Port ID SI Enc-Type Origin:Path
------------- ------ ---- -------- ------------
10.12.66.120:53340 50687 10 JSON ipi:/interfaces/interface[name=eth0]/state
ipi:/interfaces/interface[name=eth0]/state/counters
Use Case 5: Monitoring Interface State Using JSON Encoding for OpenConfig Xpath
In this use case, gnmic subscribes to the specified path using the Subscribe RPC, monitoring the state of an interface '/interfaces/interface[name=eth0]/state' using the JSON encoding for OpenConfig Xpath.
./gnmic -a 10.12.160.119:9339 -u admin -p admin --insecure --mode STREAM --stream-mode sample --sample-interval 10s subscribe --path '/interfaces/interface[name=eth0]/state' --encoding json
{
"source": "10.12.160.119:9339",
"subscription-name": "default-1713864712",
"timestamp": 1550833514789102094,
"time": "2019-02-22T11:05:14.789102094Z",
"updates": [
{
"Path": "interfaces/interface[name=eth0]/state",
"values": {
"interfaces/interface/state": {
"AdminStatus": "UP",
"Counters": {
"InBroadcastPkts": 0,
"InDiscards": 0,
"InErrors": 0,
"InFcsErrors": null,
"InMulticastPkts": 159643,
"InOctets": 902872585,
"InPkts": 733096,
"InUnicastPkts": 0,
"LastClear": 0,
"OutBroadcastPkts": 0,
"OutDiscards": 0,
"OutErrors": 0,
"OutMulticastPkts": 0,
"OutOctets": 8944684,
"OutPkts": 105520,
"OutUnicastPkts": 0
},
"Ifindex": 3,
"LastChange": 8000,
"Logical": false,
"Name": "eth0",
"OperStatus": "UP"
}
}
}
]
}
Validation
The below show command provides details about the subscriptions that have been established, including the client ID, sampling interval, encoding type, and the sensor paths that are being monitored.
OcNOS#show streaming-telemetry dynamic-subscriptions
Feature streaming telemetry : Enabled
VRF : default
Platform type : Standard range
Maximum sensor-paths : 50
Minimum sample-interval : 90
Number of active sensor-paths : 2 (Dial-In : 2, Dial-out : 0)
SI : Sampling Interval in seconds
Enc-Type : Encoding type
Origin:Path : Sensor Path
Dial-In STREAM Mode Subscription Details:
~~~~~~~~~~~~~~~~~~~~~~~~~~~~~~~~~~~~~~~~~
ClientIP:Port ID SI Enc-Type Origin:Path
------------- ------ ---- -------- ------------
10.12.66.120:53390 16340 10 JSON openconfig:/interfaces/interface[name='eth0']/state;
openconfig:/interfaces/interface[name='eth0']/state/counters;
YAML File Input for Multiple Path Subscription
Use Case 1: Configuring One Subscription Requests with Multiple Path Option
This use case illustrates the configuration of a subscription request with multiple paths using a YAML file input. It streamlines the subscription setup process by specifying the desired paths and subscription parameters directly in the YAML file.
YAML File Content (single_request.yaml)
#cat single_request.yaml
subscriptions: | #Container for subscriptions |
interface_stats_hw: | #A named subscription, where the key is the subscription name |
paths: • "ipi:/interfaces/interface[name=xe1]/state" • "ipi:/interfaces/interface[name=vlan1.10]/state" | #List of subscription paths for the named subscription |
stream-mode: sample | #One of [on-change, target-defined, sample] |
sample-interval: 12s | #Sampling interval (e.g., 12 seconds) |
encoding: json_ietf | #Encoding format for telemetry data (e.g., JSON_IETF) |
gnmic Command
# gnmic -a 10.12.91.111:9339 -u ocnos -p ocnos --insecure --config single_request.yaml subscribe
{
"source": "10.12.91.111:9339",
"subscription-name": "interface_stats_hw",
"timestamp": 1550833401388910121,
"time": "2019-02-22T11:03:21.388910184Z",
"updates": [
{
"Path": "ipi:interfaces/interface[name=xe1]/state",
"values": {
"interfaces/interface/state": {
"admin-status": "up",
"counters": {
"in-broadcast-pkts": "0",
"in-discards": "0",
"in-errors": "0",
"in-fcs-errors": "0",
"in-multicast-pkts": "0",
"in-octets": "0",
"in-pkts": "0",
"in-unicast-pkts": "0",
"last-clear": "Never",
"out-broadcast-pkts": "0",
"out-discards": "0",
"out-errors": "0",
"out-multicast-pkts": "2",
"out-octets": "164",
"out-pkts": "2",
"out-unicast-pkts": "0"
},
"ifindex": 10001,
"last-change": 0,
"logical": false,
"oper-status": "down"
}
}
}
]
}
{
"source": "10.12.91.111:9339",
"subscription-name": "interface_stats_hw",
"timestamp": 1550833401388910129,
"time": "2019-02-22T11:03:21.388110124Z",
"updates": [
{
"Path": "ipi:interfaces/interface[name=vlan1.10]/state",
"values": {
"interfaces/interface/state": {
"admin-status": "up",
"counters": {
"in-broadcast-pkts": "0",
"in-discards": "0",
"in-errors": "0",
"in-fcs-errors": "0",
"in-multicast-pkts": "0",
"in-octets": "0",
"in-pkts": "0",
"in-unicast-pkts": "0",
"last-clear": "Never",
"out-broadcast-pkts": "0",
"out-discards": "0",
"out-errors": "0",
"out-multicast-pkts": "0",
"out-octets": "0",
"out-pkts": "0",
"out-unicast-pkts": "0"
},
"ifindex": 25010,
"last-change": 22500,
"logical": false,
"oper-status": "up"
}
}
}
]
}
Validation
The below show command provides details about the subscriptions that have been established, including the client ID, sampling interval, encoding type, and the sensor paths that are being monitored.
OcNOS#show streaming-telemetry dynamic-subscriptions
Feature streaming telemetry : Enabled
VRF : default
Platform type : Standard range
Maximum sensor-paths : 50
Minimum sample-interval : 90
Number of active sensor-paths : 4 (Dial-In : 4, Dial-out : 0)
SI : Sampling Interval in seconds
Enc-Type : Encoding type
Origin:Path : Sensor Path
Dial-In STREAM Mode Subscription Details:
~~~~~~~~~~~~~~~~~~~~~~~~~~~~~~~~~~~~~~~~~
ClientIP:Port ID SI Enc-Type Origin:Path
------------- ------ ---- -------- ------------
10.12.43.135:58208 45333 12 JSON_IETF ipi:interfaces/interface[name=xe1]/state/counters
ipi:interfaces/interface[name=xe1]/state
ipi:interfaces/interface[name=vlan1.10]/state/counters
ipi:interfaces/interface[name=vlan1.10]/state
Use Case 2: Configuring Multiple Subscription Requests with Multiple Path Option
This use case illustrates the configuration of multiple subscription request with multiple paths using a YAML file input. It streamlines the subscription setup process by specifying the desired paths and subscription parameters directly in the YAML file.
YAML File Content (multiple_subs.yaml)
#cat multiple_subs.yaml
subscriptions: | # Container for subscriptions |
RAM_stats_hw: | # A named subscription for RAM statistics |
paths: "ipi:/components/component[name=RAM]/ram/state" | # List of subscription paths for the RAM_stats_hw subscription |
stream-mode: sample | # Stream mode for RAM statistics |
sample-interval: 11s | # Sampling interval for RAM statistics (e.g., 11 seconds) |
encoding: json_ietf | # Encoding format for RAM statistics (e.g., JSON_IETF) |
storage_stats_hw: | # A named subscription for storage statistics |
paths: "ipi:/components/component[name=HARD-DISK]/storage/state" | # List of subscription paths for the storage_stats_hw subscription |
stream-mode: sample | # Stream mode for storage statistics |
sample-interval: 12s | # Sampling interval for storage statistics (e.g., 12 seconds) |
encoding: json_ietf | # Encoding format for storage statistics (e.g., JSON_IETF) |
power-supply_stats_hw: | # A named subscription for power supply statistics |
paths: • "ipi:/components/component[name=PSU-1]/power-supply/state" • "ipi:/components/component[name=PSU-2]/power-supply/state" | # List of subscription paths for the power-supply_stats_hw subscription |
stream-mode: sample | # Stream mode for power supply statistics |
sample-interval: 13s | # Sampling interval for power supply statistics (e.g., 13 seconds) |
encoding: json_ietf | # Encoding format for power supply statistics (e.g., JSON_IETF) |
intf-tray_stats_hw: | # A named subscription for interface tray statistics |
paths: • "ipi:/interfaces/interface[name=xe1]/state" • "ipi:/interfaces/interface[name=vlan1.8]/state" | # List of subscription paths for the intf-tray_stats_hw subscription |
stream-mode: sample | # Stream mode for interface tray statistics |
sample-interval: 14s | # Sampling interval for interface tray statistics (e.g., 14 seconds) |
encoding: json_ietf | # Encoding format for interface tray statistics (e.g., JSON_IETF) |
gnmic Command
# gnmic -a 10.12.91.111:9339 -u ocnos -p ocnos --insecure --config multiple_subs.yaml subscribe
{
"source": "10.12.91.111:9339",
"subscription-name": "ram_stats_hw",
"timestamp": 1550833401388910128,
"time": "2019-02-22T11:03:21.388910128Z",
"updates": [
{
"Path": "ipi:components/component[name=RAM]/ram/state",
"values": {
"components/component/ram/state": {
"available-high-memory": "0",
"available-memory": "14743",
"buffers": "15",
"current-process-count": 232,
"free-swap": "0",
"shared-memory": "8",
"total-high-memory": "0",
"total-memory": "16012",
"total-swap": "0",
"used-memory": "1269"
}
}
}
]
}
{
"source": "10.12.91.111:9339",
"subscription-name": "storage_stats_hw",
"timestamp": 1550833401388910127,
"time": "2019-02-22T11:03:21.388910127Z",
"updates": [
{
"Path": "ipi:components/component[name=HARD-DISK]/storage/state",
"values": {
"components/component/storage/state": {
"free-memory": "16908",
"total-memory": "30208",
"used-memory": "5020"
}
}
}
]
}
{
"source": "10.12.91.111:9339",
"subscription-name": "power-supply_stats_hw",
"timestamp": 1550833401388910126,
"time": "2019-02-22T11:03:21.388910126Z",
"updates": [
{
"Path": "ipi:components/component[name=PSU-1]/power-supply/state",
"values": {
"components/component/power-supply/state": {
"capacity": "650",
"fan1-rpm": 24288,
"operational-status": "not-present",
"output-current": "8.28",
"output-voltage": "12.07",
"power-consumption": "99",
"temperature-sensor1": "22",
"temperature-sensor2": "28",
"temperature-sensor3": "24"
}
}
}
]
}
{
"source": "10.12.91.111:9339",
"subscription-name": "power-supply_stats_hw",
"timestamp": 1550833401388910125,
"time": "2019-02-22T11:03:21.388910125Z",
"updates": [
{
"Path": "ipi:components/component[name=PSU-2]/power-supply/state",
"values": {
"components/component/power-supply/state": {
"operational-status": "running",
"temperature-sensor1": "0",
"temperature-sensor2": "0",
"temperature-sensor3": "0"
}
}
}
]
}
{
"source": "10.12.91.111:9339",
"subscription-name": "intf-tray_stats_hw",
"timestamp": 1550833401388910123,
"time": "2019-02-22T11:03:21.388910123Z",
"updates": [
{
"Path": "ipi:interfaces/interface[name=xe1]/state",
"values": {
"interfaces/interface/state": {
"admin-status": "up",
"counters": {
"in-broadcast-pkts": "0",
"in-discards": "0",
"in-errors": "0",
"in-fcs-errors": "0",
"in-multicast-pkts": "0",
"in-octets": "0",
"in-pkts": "0",
"in-unicast-pkts": "0",
"last-clear": "Never",
"out-broadcast-pkts": "0",
"out-discards": "0",
"out-errors": "0",
"out-multicast-pkts": "5",
"out-octets": "410",
"out-pkts": "5",
"out-unicast-pkts": "0"
},
"ifindex": 10001,
"last-change": 0,
"logical": false,
"oper-status": "down"
}
}
}
]
}
{
"source": "10.12.91.111:9339",
"subscription-name": "intf-tray_stats_hw",
"timestamp": 1550833401388910122,
"time": "2019-02-22T11:03:21.388910122Z",
"updates": [
{
"Path": "ipi:interfaces/interface[name=vlan1.8]/state",
"values": {
"interfaces/interface/state": {
"admin-status": "up",
"counters": {
"in-broadcast-pkts": "0",
"in-discards": "0",
"in-errors": "0",
"in-fcs-errors": "0",
"in-multicast-pkts": "0",
"in-octets": "0",
"in-pkts": "0",
"in-unicast-pkts": "0",
"last-clear": "Never",
"out-broadcast-pkts": "0",
"out-discards": "0",
"out-errors": "0",
"out-multicast-pkts": "0",
"out-octets": "0",
"out-pkts": "0",
"out-unicast-pkts": "0"
},
"ifindex": 25008,
"last-change": 22500,
"logical": false,
"oper-status": "up"
}
}
}
]
}
Validation
The below show command provides details about the subscriptions that have been established, including the client ID, sampling interval, encoding type, and the sensor paths that are being monitored.
OcNOS#show streaming-telemetry dynamic-subscriptions
Feature streaming telemetry : Enabled
VRF : default
Platform type : Standard range
Maximum sensor-paths : 50
Minimum sample-interval : 90
Number of active sensor-paths : 8 (Dial-In : 8, Dial-out : 0)
SI : Sampling Interval in seconds
Enc-Type : Encoding type
Origin:Path : Sensor Path
Dial-In STREAM Mode Subscription Details:
~~~~~~~~~~~~~~~~~~~~~~~~~~~~~~~~~~~~~~~~~
ClientIP:Port ID SI Enc-Type Origin:Path
------------- ------ ---- -------- ------------
10.12.43.155:58267 9453 14 JSON_IETF ipi:interfaces/interface[name=xe1]/state/counters
ipi:interfaces/interface[name=xe1]/state
ipi:interfaces/interface[name=vlan1.8]/state/counters
ipi:interfaces/interface[name=vlan1.8]/state
10.12.43.155:58114 31533 11 JSON_IETF ipi:components/component[name=RAM]/ram/state
10.12.43.155:58345 3374 12 JSON_IETF ipi:components/component[name=HARD-DISK]/storage/state
10.12.43.155:58222 35994 13 JSON_IETF ipi:components/component[name=PSU-1]/power-supply/state
ipi:components/component[name=PSU-2]/power-supply/state
Use Case 3: Configuring Multiple Subscription Requests with Prefix Option
This use case illustrates the configuration of multiple subscription request with prefix option using a YAML file input. It streamlines the subscription setup process by specifying the desired paths and subscription parameters directly in the YAML file.
YAML File Content (prefix_path.yaml)
#cat prefix_path.yaml
subscriptions: | #Container for subscriptions |
RAM_stats_hw: | #A named subscription for RAM statistics |
prefix: "ipi:" | #Common prefix for paths in this subscription |
paths: "/components/component[name=RAM]/ram/state" | #List of subscription paths for the RAM_stats_hw subscription |
stream-mode: sample | #Stream mode for RAM statistics |
sample-interval: 11s | #Sampling interval for RAM statistics (e.g., 11 seconds) |
encoding: json_ietf | #Encoding format for RAM statistics (e.g., JSON_IETF) |
intf-tray_stats_hw: | #A named subscription for interface tray statistics |
prefix: "ipi:" | #Common prefix for paths in this subscription |
paths: • "ipi:/interfaces/interface[name=xe1]/state" • "ipi:/interfaces/interface[name=vlan1.8]/state" | #List of subscription paths for the intf-tray_stats_hw subscription |
stream-mode: sample | #Stream mode for interface tray statistics |
sample-interval: 14s | #Sampling interval for interface tray statistics (e.g., 14 seconds) |
encoding: json_ietf | #Encoding format for interface tray statistics (e.g., JSON_IETF) |
gnmic Command
# gnmic -a 10.12.91.111:9339 -u ocnos -p ocnos --insecure --config prefix_path.yaml subscribe
{
"source": "10.12.91.111:9339",
"subscription-name": "ram_stats_hw",
"timestamp": 1550833401188910121,
"time": "2019-02-22T11:03:21.388910121Z",
"updates": [
{
"Path": "components/component[name=RAM]/ram/state",
"values": {
"components/component/ram/state": {
"available-high-memory": "0",
"available-memory": "14793",
"buffers": "16",
"current-process-count": 231,
"free-swap": "0",
"shared-memory": "8",
"total-high-memory": "0",
"total-memory": "16012",
"total-swap": "0",
"used-memory": "1219"
}
}
}
]
}
{
"source": "10.12.91.111:9339",
"subscription-name": "intf-tray_stats_hw",
"timestamp": 1550830401388910120,
"time": "2019-02-22T11:03:21.388900120Z",
"updates": [
{
"Path": "interfaces/interface[name=xe1]/state",
"values": {
"interfaces/interface/state": {
"admin-status": "up",
"counters": {
"in-broadcast-pkts": "0",
"in-discards": "0",
"in-errors": "0",
"in-fcs-errors": "0",
"in-multicast-pkts": "0",
"in-octets": "0",
"in-pkts": "0",
"in-unicast-pkts": "0",
"last-clear": "Never",
"out-broadcast-pkts": "0",
"out-discards": "0",
"out-errors": "0",
"out-multicast-pkts": "9",
"out-octets": "738",
"out-pkts": "9",
"out-unicast-pkts": "0"
},
"ifindex": 10001,
"last-change": 0,
"logical": false,
"oper-status": "down"
}
}
}
]
}
{
"source": "10.12.91.111:9339",
"subscription-name": "intf-tray_stats_hw",
"timestamp": 1550833401288910122,
"time": "2019-02-22T11:03:21.388912122Z",
"updates": [
{
"Path": "interfaces/interface[name=vlan1.8]/state",
"values": {
"interfaces/interface/state": {
"admin-status": "up",
"counters": {
"in-broadcast-pkts": "0",
"in-discards": "0",
"in-errors": "0",
"in-fcs-errors": "0",
"in-multicast-pkts": "0",
"in-octets": "0",
"in-pkts": "0",
"in-unicast-pkts": "0",
"last-clear": "Never",
"out-broadcast-pkts": "0",
"out-discards": "0",
"out-errors": "0",
"out-multicast-pkts": "0",
"out-octets": "0",
"out-pkts": "0",
"out-unicast-pkts": "0"
},
"ifindex": 25008,
"last-change": 22500,
"logical": false,
"oper-status": "up"
}
}
}
]
}
Validation
The below show command provides details about the subscriptions that have been established, including the client ID, sampling interval, encoding type, and the sensor paths that are being monitored.
OcNOS#show streaming-telemetry dynamic-subscriptions
Feature streaming telemetry : Enabled
VRF : default
Platform type : Standard range
Maximum sensor-paths : 50
Minimum sample-interval : 90
Number of active sensor-paths : 5 (Dial-In : 5, Dial-out : 0)
SI : Sampling Interval in seconds
Enc-Type : Encoding type
Origin:Path : Sensor Path
Dial-In STREAM Mode Subscription Details:
~~~~~~~~~~~~~~~~~~~~~~~~~~~~~~~~~~~~~~~~~
ClientIP:Port ID SI Enc-Type Origin:Path
------------- ------ ---- -------- ------------
10.12.43.154:50167 32137 11 JSON_IETF ipi:components/component[name=RAM]/ram/state
10.12.43.154:50614 36412 14 JSON_IETF ipi:interfaces/interface[name=vlan1.8]/state/counters
ipi:interfaces/interface[name=vlan1.8]/state
ipi:interfaces/interface[name=xe1]/state/counters
ipi:interfaces/interface[name=xe1]/state
Implementation Examples
Typical Use Cases
• Enable Streaming Telemetry to monitor interface counters and the health of the OcNOS target device, including memory, CPU usage, fan speed, and temperature.
• Use telemetry data to trigger automated network tasks based on specific conditions.
Integration with Existing Features
Streaming Telemetry can be used in conjunction with other network monitoring and management features.
Dial-In Mode Commands
The Streaming Telemetry introduces the following configuration commands.
show streaming-telemetry dynamic-subscriptions
Use this command to display the streaming telemetry dial-in configurations.
Command syntax
show streaming-telemetry dynamic-subscriptions
Parameters
None
Command Mode
Exec mode
Applicability
This command was introduced in OcNOS version 6.4.1.
Examples
The following example displays the streaming telemetry dial-in configuration output.
OcNOS#show streaming-telemetry dynamic-subscriptions
Feature streaming telemetry : Enabled
VRF : default
Platform type : Standard range
Maximum sensor-paths : 50
Minimum sample-interval : 90
Number of active sensor-paths : 3 (Dial-In : 3, Dial-out : 0)
SI : Sampling Interval in seconds
Enc-Type : Encoding type
Origin:Path : Sensor Path
Dial-In STREAM Mode Subscription Details:
~~~~~~~~~~~~~~~~~~~~~~~~~~~~~~~~~~~~~~~~~
ClientIP:Port ID SI Enc-Type Origin:Path
------------- ------ ---- -------- ------------
10.12.43.175:59108 12396 10 JSON_IETF ipi:interfaces/interface[name=eth0]/state/counters
ipi:interfaces/interface[name=eth0]/state
10.12.43.175:59114 6001 15 JSON_IETF ipi:components/component[name=CPU]/cpu/state
The below table explains the output fields.
Field | Description |
|---|---|
Feature streaming telemetry | Marked as “Enabled” confirms that streaming telemetry is active on the device. |
VRF | Specifies the VRF type. |
Platform type | Displays the platform type is standard or high range. |
Maximum sensor-paths | Shows the maximum number of sensor paths allowed. For more details, refer to Scale Scenarios section. |
Minimum sample-interval | Indicates the minimum sampling interval in seconds. For more details, refer to Scale Scenarios section. |
Number of active sensor-paths | Shows the total number of active sensor paths for Dial-In and Dial-Out subscriptions (Stream mode subscriptions). |
Dial-In Subscription Details | Check the Dial-in subscription details. |
ClientIP: Port | Verify that the client IP and port listed matches the client that should be receiving telemetry data. |
SI: Sampling-interval | Confirm that the sampling interval matches the desired frequency at which data is collected and sent. |
Enc-type: Encoding-type | Ensure that the encoding type (e.g., JSON_IETF) matches the expected format for telemetry data. |
Origin:Path | Review the sensor paths to ensure that they correspond to the specific data sources or paths of interest. |
Abbreviations
The following are some key abbreviations and their meanings relevant to this document:
Acronym | Description |
JSON | JavaScript Object Notation |
RPC | Remote Procedure Call |
gNMI | gRPC Network Management Interface |
JSON-IETF | JSON-Internet Engineering Task Force |
Glossary
The following provides definitions for key terms used throughout this document.
Streaming Telemetry | A monitoring approach that efficiently transmits operational data from OcNOS routers to remote management systems in real-time for analysis, troubleshooting, and network monitoring. |
Telemetry Data | Structured operational data generated by routers that is transmitted in real-time to external systems for analysis. |
JSON-IETF | JSON-IETF is a data interchange format that follows the specifications defined by the IETF. It is a lightweight, text-based format used for representing structured data. JSON-IETF is commonly used for configuration and data exchange in various network and Internet-related protocols. |
Remote Management System | An external system responsible for monitoring, managing, and analyzing data received from network devices. |
Network Health | The overall condition and performance of a network, including factors like stability, resource utilization, and data flow. |
Resilient Network | A network designed to withstand failures or disruptions, maintaining functionality even in challenging conditions. |